
Public culture · Data visualization
Shanghai Library East: website & data visualization dashboard
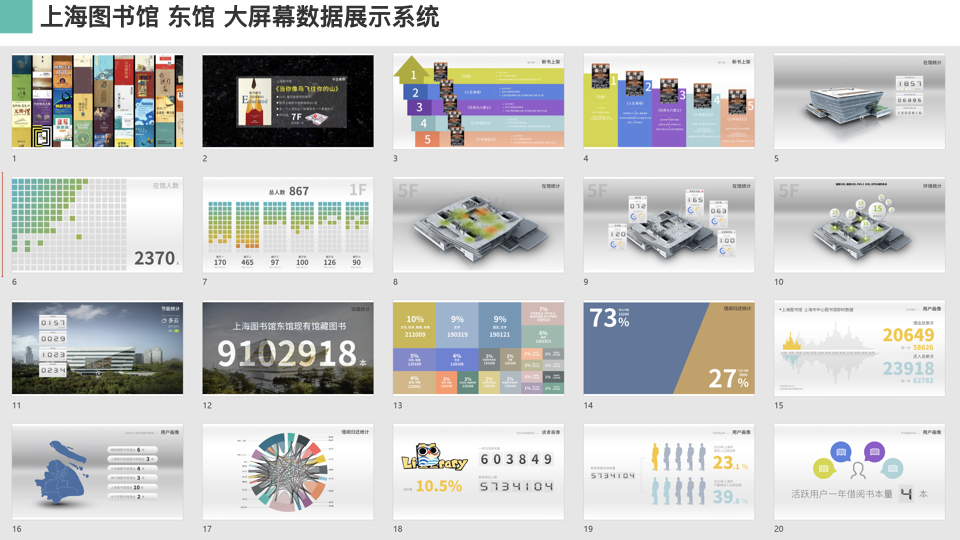
We built the official website and a big-data visualization dashboard for Shanghai Library East, covering library operations, service data and the information display of a large public cultural space.
CHALLENGE
Turn a busy public institution's data into something you can read at a glance
A landmark public library generates a lot of operational data — collections, footfall, in-library activity and reading services. The challenge was to present it both to the public through a proper website, and to operators through a large-screen dashboard that makes the state of the library obvious at a glance.
SOLUTION · What we did
A public website plus a live visualization dashboard
- Official website covering library services and information.
- Big-data visualization dashboard for large-screen display.
- Collections, visitor flow, in-library statistics and reading operations unified in one view.
- Built to the reliability expectations of a public cultural institution.
VALUE
Related capability: data dashboards and large-screen visualization are a core part of our custom software work. See our software services →
START · Dashboards
Need a data dashboard or a public institution website?
Initial consultation and demo can start free of charge.
 Scan to add Tony on WeChat